Coronavirus curve up, lockdown impact may take a while
There is good reason why the central government and several states are inclined to extend the current lockdown beyond April 14. Two weeks into the lockdown period, there is no indication yet that the largest quarantine exercise in the world is having the desired effect of slowing down the spread of the COVID-19 disease.
Scientists using computer models to measure the spread of an infectious disease say they are yet to notice a “flattening of the growth curve”. This does not mean that the lockdown has been a wasted exercise, however. It is too early to draw such a conclusion.
Sitabhra Sinha of the Institute of Mathematical Sciences in Chennai said he expected the impact of the lockdown to become visible in the next couple of days. That is because at least some of the crucial states, including Maharashtra that has the highest number of cases, seem to have begun to show a slight bending of the growth curve.
“We were hoping to notice a flattening of the growth curve after two weeks of the lockdown coming into effect. As of now, that does not seem to be happening. But something interesting seems to be going on at the state level. For the last two days (April 6 onwards), the curve for Maharashtra is showing signs of bending. It is still early days, but noticeable,” Sinha said.
“Delhi and Uttar Pradesh (both having more than 300 caseloads) too have started to show a bending of the curve from April 3, and those trends seem more concrete,” Sinha added.
“Kerala and Tamil Nadu seem to be having the most interesting trajectories. In both these states, the disease seems to be spreading linearly and not exponentially as at the national level or for other states,” Sinha said.
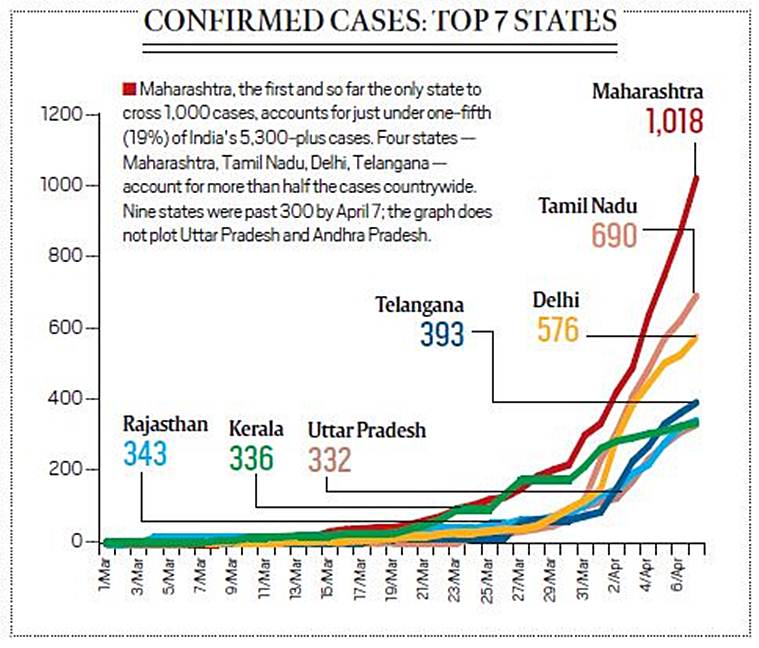
 Coronavirus curve in India: The number of coronavirus cases in India has been growing exponentially.
For modellers, flattening or bending of the growth line represents a slowing down in the spread of an infectious disease. It does not mean that the spread is being contained, just that the rate of growth in the number of people being infected is slowing down.
The lockdown was meant to achieve exactly that. By confining a majority of the population to their homes for a three-week period, and limiting their contact with other people, it was hoped that the spread of the disease would be slowed down considerably, because infected people would not be able to pass it on to others. The slowdown, it was hoped, would provide government authorities some breathing space to ramp up health and hospital infrastructure to deal with a possible explosion of infections at a later point.
While that effect is not yet visible, Sinha says neither the migrant movement for the first three days of the lockdown, nor the large number of infections flowing out of the Tabligh Jamaat event in Nizamuddin are the possible explanations. “The gathering (at Nizamuddin) took place about 10 days before lockdown came into force, and most of the movement of the people involved had already happened by that time. So, while it has increased India’s caseload, this could not be the reason why we are yet to see a slowdown in growth rate. As for the migrant issue, that only meant that the lockdown was effectively delayed by three days because of continued movement — so, theoretically speaking, its effect can be nullified by extending the lockdown by another three days,” he said.
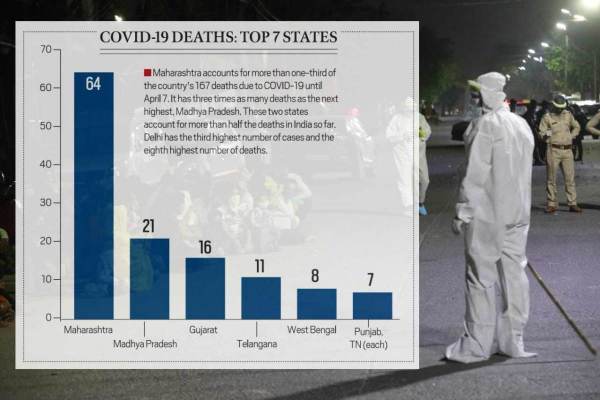
 Coronavirus curve in India: Maharashtra accounts for more than one-third of the country’s 167 deaths due to COVID-19 until April 7.
The possible explanations, Sinha pointed out, can be seen in the way the disease is spreading in individual states and regions. In a different exercise, a group of scientists at the Indian Institute of Information Technology in Delhi have shown that the rates of growth of the disease are very different in different states. Twelve states and Union Territories have an infection transmission rate higher than the national average. Out of these, just five states account for more than half of the country’s caseload as on April 6.
In the study of infectious disease, the “basic reproduction number”, or R-naught is used to assess the severity of an outbreak. This number is an average, reflecting the number of people infected by one infected person.
The researchers at IIT Delhi have a current nationwide R-naught of 1.4, meaning that an infected person is passing COVID-19 onto an average of 1.4 other people. If an R-naught (R0) is above one, the outbreak will lead to an epidemic. If it is below one, the outbreak will eventually die out.
 Coronavirus curve in India: The number of coronavirus cases in top seven states. Maharashtra has seen the highest COVID-19 infections in India (1,108), followed by Tamil Nadu (690) and Delhi (567).
The five states with high case numbers, high spread within the state, and high transmission numbers are Maharashtra (with a R0 of 1.58), Tamil Nadu (1.53), Delhi (1.42), Andhra Pradesh (1.55), and Karnataka (1.44). While Madhya Pradesh has a relatively high case number (165) and transmission rate (1.58), its spread throughout its districts is less (16 per cent). Although they have lower case numbers, some of the states with still high transmission rates are West Bengal (1.7), Gujarat (1.61), Bihar (1.6), and Jharkhand (1.58).
The calculations — called SIR (Susceptible, Infected and Recovered) models — used to produce the reproduction numbers do have several weaknesses.
“If someone gives an estimate of an R0 to a policy maker, they should be aware that these models are prone to wild fluctuations. They assume an equilibrium and work best when numbers have stabilised over time. It looks as though right now, the epidemic in India is evolving and is very dynamic. These models are also agnostic to the ground truth about testing,” said IIIT Delhi computational biologist Tavpritesh Sethi, who built the models along with computer science professor Ponnurangam Kumaraguru, computer biologist Sriram K, and others at a computational medicine group called TavLab and PreCog Research Group at the Institute.
Some main assumptions made in the model that may be accounted for in varying ways, include population density, mobility factors, interactions before the lockdown. The researchers have also noticed that the numbers are just beginning to stabilise, probably due to the lockdown.
Sinha of the Institute of Mathematical Sciences is himself involved in a modelling exercise with his colleagues, and his calculation has yielded a national R-naught of 1.83.
On March 19, Sinha’s model had found a national number of 1.7. With this rate prediction, he had predicted at the time that India would have 200 to 500 positive cases in five days. That number was around 530 on March 24.
Since then, the R-naught in Sinha’s model has not changed significantly — maintained at 1.83 as of April 6. “I am hoping to see a slight flattening of the curve any time now, as I expect the effect of the lockdown to kick in after about two weeks,” he told The Indian Express.
