#DailyUpdate #COVID2019
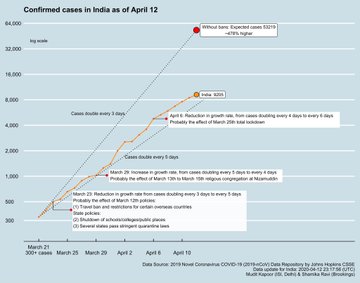
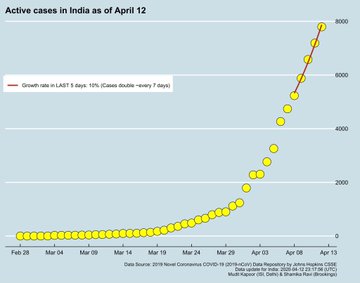
India is flattening the curve. The growth rate has shown a consistent decline – from April 6th onwards – approximately 2 weeks after the #Lockdown . Active cases are doubling every 7 days.
R0 data shows India’s coronavirus infection rate has slowed, gives lockdown a thumbs up
Bengaluru/New Delhi: There is a glimmer of hope in India’s battle against Covid-19 from a key metric of the rate of infection of coronavirus.
The metric, called the R-Naught or R-Zero – and written as R0 – estimates that the infection rate in India has fallen to 1.55 on 11 April from 1.83 on 6 April, indicating that the restrictions imposed under the three-week lockdown could be helping.
The metric has been estimated by scientists at the Institute of Mathematical Sciences (IMS) in Chennai. The metric of 1.55 means every Covid-19 patient could infect 1.55 people if placed in a crowd of uninfected individuals.
As on 13 April, India has 8,048 people infected by coronavirus while 324 patients died of it. At its highest, India’s R0 was estimated at 4 on 23 March, according to a study by the Indian Council of Medical Research (ICMR).
The R0 is a metric calculated through modelling, and is meant to examine how a certain disease will progress while guiding authorities on how to deal with it. An R0 of less than 1 means a disease will not grow to epidemic proportions, as was the case with the 2012 MERS outbreak that originated in Saudi Arabia.
However, if people are vaccinated or have immunity through prior infection, even a high R0 won’t translate into high fatalities, as is the case with measles, which has an estimated R0 of 12-18.
Experts at IMS had predicted that Covid-19 would spawn at least 35,000 cases by 20 April if social distancing was not enforced, but the government’s efforts seem to have helped control its progression.
“Without the lockdown, India was looking at lakhs of cases – we have data to believe that it would’ve been an uncontrollable scenario,” a top government source told ThePrint.
Although the Tablighi Jamaat event derailed the containment to some extent, the country continues to have benefitted greatly from the lockdown, the source said. “The growth rate has shown an encouraging decline since the lockdown … But since the number of cases are rising, the lockdown needs to be extended.”
Shamika Ravi, a former member of the PM’s Economic Advisory Council and scholar at the Brookings Institute, seemed to echo that when she tweeted Monday that India’s Covid-19 cases could have surpassed 53,000 by now without the restrictions.
An accompanying graphic that cites data from the Johns Hopkins Coronavirus Resource Centre notes a slowing growth rate in India as of 6 April, with cases doubling every six days instead of four.
Still a matter of research
Global estimates for the R0 of novel coronavirus vary from 2 to 2.5, but this has manifested in different ways around the world. While there have been 4.92 lakh cases and 18,516 deaths (as of 12 April, WHO data) in the US, where the seriousness of Covid-19 is seen to have been undermined for weeks by President Donald Trump, it has resulted in 78,995 cases and 9,875 deaths in the UK, which locked down on 23 March after first toying with the idea of greater exposure to beat the disease.
In Italy, where the disease has killed over 19,400 people, officials estimate the R0 dropped from 2-3 to one after weeks of intense restrictions whose violation carried strict penalties.
Research on the exact figure continues. A study conducted by US-based researchers, published in the journal Emerging Infectious Diseases last week, suggested Covid-19 might have been over twice as infectious in Wuhan, where it originated, than was earlier believed. Their findings indicated that the R0 for Covid-19 in Wuhan wasn’t 2.2-2.7, as suggested by earlier estimates computed in January, but 5.7. The number hasn’t been corroborated by other studies yet.
“There have been examples of outbreaks for which estimates of R0 have initially been exaggerated, only to settle down to smaller values afterwards,” said Gautam Menon, a biophysics professor at Ashoka University, Sonepat, who also works on infectious-disease modeling at IMS.
Calculating the R0
Understanding the dynamics of an infectious disease in its early stages is challenging because of a number of factors, such as lack of data, shortage of reagents (chemicals) for testing or other processes, and the sudden onset of counter-measures.
The first estimation of R0 for Wuhan, 2.2, was published on 29 January using data from 425 confirmed cases dating before 22 January. A month later, it was estimated to be slightly higher, at 2.68.
Now, the amount of data available is much higher — enabling researchers to make more accurate estimates.
“When the number of cases is relatively small (which is the case at the early stage of the epidemic, which is precisely the period when the R0 is defined), there will be a lot of fluctuation in the number of people that each infected person passes on the disease to,” Sitabhra Sinha, an IMS professor who works on mathematical modeling, told ThePrint.
“As R0 is defined as the average number of people who are infected by a single person, obviously the averaging will get better as we have more and more cases.”
Menon said the wild swing from 2.4 to 5.7 suggested in the Wuhan study was “certainly outside the range that prior models have considered reasonable”.
“It is not totally inconsistent with the fact that a large number of cases appear to be asymptomatic, i.e. you should count them in the numbers infected by a single individual carrying the disease, thus in terms of R0, but the number that shows up on testing those showing symptoms is much smaller,” he said.
The factors R0 depends on
R0 is an important yardstick to study the progression of a disease, but varies with time, geography and containment measures. It shouldn’t be taken at face value by laypeople.
The R0 is, instead, important for drug-makers, vaccinologists, epidemiologists and public health officials, as it informs them about the urgency they need to employ to avoid the worst-case scenario.
The R0 of a disease depends on three factors: The probability of infection when a susceptible person comes in contact with an infected individual, the average rate of contact between susceptible and infected individuals, and the duration during which an individual spreads the infection.
It is calculated through mathematical epidemiological models that compute how fast the virus spreads between “generations”.
The very first person who contracts the virus, “patient zero” for the pandemic, serves as the “index case”. Every individual this person directly gives the virus to becomes a part of the first generation, and every individual they infect becomes the second, and so on (the search for the Covid-19 patient zero is still on).
As an infectious disease spreads out of control exponentially, it becomes difficult to model, considering social-distancing measures also induce a bias in data.
So, the R0 for a disease is simply the number of persons the index case infected, when countermeasures were yet to kick in.
R0 and herd immunity
Any revisions in the R0 estimate threatens to have a massive impact on the authorities’ response to a disease.
According to the researchers who conducted the Wuhan study, when R0 is around 2.2, only around 55 per cent of the population needs to be immune — through vaccine or prior infection — for the disease to stop spreading.
At an R0 of 5.7, this threshold rises to 82 per cent, a number that puts pressure on public health systems to come up with vaccinations or drugs faster, the researchers said.
This concept is known as herd immunity — when enough people in a community are immune that a disease stops spreading. It was a strategy the UK flirted with for Covid-19 before a rising incidence and a stressed healthcare system forced it to change course.
“The R0 values (5.7) we estimated have important implications for predicting the effects of pharmaceutical and non-pharmaceutical interventions,” the researchers stated.
Speaking to ThePrint, Sinha said if an epidemic is allowed to “run its natural course, eventually the disease will run out of fresh susceptible individuals it can infect, as most people around a new infected person will already have been infected earlier”.
“At that point, the epidemic would have peaked, and then, after plateauing out, it will gradually start coming down — eventually either getting completely extinguished in the human population (although it may, in principle, continue to survive in animal reservoirs) or becoming endemic,” Sinha added.
‘A moving target’
Epidemiologists no longer talk about R0 once the epidemic comes close to peaking, but rather of R, the effective reproduction number, which is the number of people who are likely to get infected from a sick person when a significant percentage of the population has immunity.
“R0 is a moving target — it depends on the properties of the infectious agent, the coronavirus in this case, its interaction with humans, which brings in issues of prior immunity or exposure as the epidemic grows, as well as social interactions, which are suppressed by physical-distancing measures,” said Menon.
“For this reason, R0 is more useful to calculate in the initial stages of the epidemic and will have to be replaced by R after that. We will at least have to wait till we have good estimates for the fraction of the population that is infected but has remained asymptomatic to understand it better.”
Along with factors like public behaviour, the value of R0 depends on the model used to calculate it. As there is more than one in use around the world, different estimates carry different values.
Different models also employ different parameters, for example, the variants of the fatality rate, which indicates the number of patients who die because of a disease.
The variants are case fatality ratio (CFR), the percentage of formally diagnosed people succumbing to illness, and infection fatality rate (IFR), which depicts deaths among everyone infected with an illness irrespective of whether they were diagnosed or were symptomatic.
“The case fatality rate measures how deadly a disease is, while R0 measures how infectious it is, i.e., how easily it spreads. For example, Ebola has an extremely high case fatality rate of 50 per cent, but a relatively low R0 of around 2, while measles, whose R0 has been estimated to be as high as 18, has a much lower average case fatality rate of 15 per cent,” Sinha said.
THE PRINT


